Market Outlook
November 09, 2016
Market Cues
Domestic Indices
Chg (%)
(Pts)
(Close)
Indian markets are likely to open negative tracking SGX nifty. In a sudden move the
BSE Sensex
0.5
132
27,591
Govt has demonetized the `500 and `1,000 currency notes. This with news of
Nifty
0.5
47
8,544
Trump leading the counts in US elections so far is going to weigh heavy on our
Mid Cap
0.4
47
12,961
markets today.
Small Cap
0.2
21
13,052
The Govt of India has take a historic step to curb the black money in the system,
Bankex
0.8
183
22,335
effective from mid night 8th November 2016, the `500 and `1,000 currency notes
has been demonetized. Which means the old currency of the same denomination
Global Indices
Chg (%)
(Pts)
(Close)
will not be valid and RBI will introduce the new currency of `500 and `2,000 with
Dow Jones
0.4
73
18,333
enhanced security measures from soon.
Nasdaq
0.4
120
5,194
While this will bring a lot of efficiency in the economy, our markets could show a
FTSE
0.5
36
6,843
knee jerk reaction in the opening. But structurally it will be positive move for the
Nikkei
(0.0)
(6)
17,171
entire economy and equities in the long run.
Hang Seng
0.5
108
22,909
In the near term real estate companies will see slow down which could also impact
Shanghai Com
0.5
15
3,148
housing finance companies in turn. However, real-estate sector which had witnessed
large unsold inventory over the last few years would become relatively affordable
Advances / Declines
BSE
NSE
and in the medium term HFCs could see growth picking up.
Advances
1,328
689
Result Previews & Review
Declines
1,581
981
Ashok Leyland Q2FY17 Result
Unchanged
118
76
Result Preview- Lupin and Cipla Q2FY17
Result Review- Sanofi India Q3CY16
Volumes (` Cr)
Detailed analysis on Pg2
BSE
3,142
Investor’s Ready Reckoner
NSE
19,450
Key Domestic & Global Indicators
Stock Watch: Latest investment recommendations on 150+ stocks
Net Inflows (` Cr)
Net
Mtd
Ytd
Refer Pg6 onwards
FII
86
(144)
44,870
MFs
294
287
22,339
Top Picks
CMP
Target
Upside
Company
Sector
Rating
(`)
(`)
(%)
Top Gainers
Price (`)
Chg (%)
Amara Raja Batteries Auto & Auto Ancill.
Buy
1,010
1,218
20.5
Gdl
250
7.1
HCL Tech
IT
Buy
808
1,000
23.7
Asian Granito
Capital Goods
Buy
261
351
34.6
Ceatltd
1,306
7.0
Equitas Holdings
Financials
Buy
170
235
38.0
Tatamotors
540
6.5
Navkar Corporation Others
Buy
197
265
34.3
Sreinfra
87
4.9
More Top Picks on Pg4
Enginersin
262
4.4
Key Upcoming Events
Previous
Consensus
Date
Region
Event Description
Top Losers
Price (`)
Chg (%)
Reading
Expectations
Nov 09 US
Initial Jobless claims
265.00
260.00
Bergepaint
246
(3.9)
Nov 10 China
Consumer Price Index (YoY)
1.90
2.10
Sunpharma
635
(3.4)
Nov 10 India
Imports YoY%
(2.50)
Crompgreav
83
(3.3)
Nov 10 China
Industrial Production (YoY)
6.10
6.20
Intellect
154
(3.1)
Nov 11 India
Exports YoY%
4.60
Escorts
347
(2.9)
Nov 14 India
Industrial Production YoY
(0.70)
0.60
As on November 08, 2016
Nov 14 India
Monthly Wholesale Prices YoY%
3.57
6.(
More Events on Pg5
Market Outlook
November 09, 2016
Ashok Leyland Q2FY17 Result
Ashok Leyland reported a 7% decline in its Q2FY17 revenues at `4,912 cr. While
there has been a decline and considered seasonally weak, the revenues growth
seems has been better than expected. Though volumes were down by ~10%, it
seems realization was better than expected which has insulated the fall in revenues
to large extent. On positive side improvement in gross margin helped in better
EBITDA margins for the quarter. Overall volumes declined by 10% to 33,440 units.
Sales of medium and heavy commercial vehicles declined by 15% yoy to 25,340
units, while the sales of LCV declined by 9% to 8,100 units.
Result Preview
Lupin (CMP: `1,519 / TP: `1,809 /Upside:19.9%)
Lupin, is expected to post sales of `4,300cr, registering a yoy growth of 35.3%,
mainly aided by exports. On operating front, the EBITDA margins are expected to
come in at 24.3% V/s 16.6% in 2QFY2016. Consequently, Adj. PAT is expected to
come in at `782cr V/s `409cr in 2QFY2016, yoy growth of 91.5%. We maintain
our buy rating on the stock.
Y/E
Sales OPM
PAT
EPS ROE P/E P/BV EV/EBITDA EV/Sales
March
(` cr)
(%)
(` cr)
(`)
(%)
(x)
(x)
(x)
(x)
FY2017E
15,912
26.4
2,611
58.1
21.4
26.0
5.1
16.3
4.3
FY2018E
18,644
26.7
3,117
69.3
20.9
21.8
4.1
13.2
3.5
Cipla (CMP: `517 / TP: `490/Upside: -8.7%)
Cipla, is expected to post sales of `3,737cr, registering a yoy growth of 11.2%,
mainly aided by domestic formulations. On operating front, the EBITDA margins
are expected to come in at 16.5% V/s 22.9% in 2QFY2016, mainly on back of
base effect. Consequently, Adj. PAT is expected to come in at `498cr V/s `431cr in
2QFY2016, yoy growth of 15.5%. We recommend a reduce rating on the stock.
Y/E
Sales OPM
PAT
EPS ROE P/E P/BV EV/EBITDA EV/Sales
March
(` cr)
(%)
(` cr)
(`)
(%)
(x)
(x)
(x)
(x)
FY2017E
15,378
17.4
1,736
21.6
13.7
24.8
3.2
17.3
3.0
FY2018E
18,089
18.4
2,185
27.2
15.2
19.7
2.8
13.6
2.5
Result Review
Sanofi India (CMP: `4,263 / TP: /Upside:)
Sanofi India, posted results below expectations on all fronts. The sales came in at
`583cr V/s `600cr expected, posting a yoy growth of 5.4%. On operating front,
the EBITDA margins, came in at 17.8% V/s 19.0% expected and 19.7% in
3QCY2015. Consequently, Adj. PAT, came in at `81cr V/s `73cr in 3QCY2015,
yoy growth of 11.9%. This was against the expectations of `94cr. We maintain our
neutral rating on the stock.
Market Outlook
November 09, 2016
Y/E
Sales OPM
PAT
EPS ROE P/E P/BV EV/EBITDA EV/Sales
March
(` cr)
(%)
(` cr)
(`)
(%)
(x)
(x)
(x)
(x)
CY2016E
2,277
17.3
344
149.4
25.1
28.5
5.1
24.7
4.3
CY2017E
2,597
17.3
378
164.4
27.6
25.9
4.1
20.2
3.5
Economic and Political News
Hillary Clinton recognises India as a strategic ally
Digital payments and wallets companies to improve market share on black
money curb move
Corporate News
Indigo net jumps 24% to `140cr
Godrej Consumer products reported a 44% increase in PAT to `318cr for the
quarter.
GSK Consumer net down 16%
Bharat Forge reports 26% fall in Q2FY17 PAT at `127cr
PNB may quit IBA-wage packages, plans own salary structure
Market Outlook
November 09, 2016
Quarterly Bloomberg Brokers Consensus Estimate
Lupin Ltd Consol - Nov 9, 2016
Particulars ( ` cr)
2QFY17E
2QFY16
y-o-y (%)
1QFY17
q-o-q (%)
Net sales
4,423
3,178
39.2
4,314
2.5
EBITDA
1,372
672
104.2
1,308
4.9
EBITDA margin (%)
31.0
21.1
30.3
Net profit
793
409
93.9
882
(10.1)
Rural Electrification Corp Ltd - Nov 9, 2016
Particulars ( ` cr)
2QFY17E
2QFY16
y-o-y (%)
1QFY17
q-o-q (%)
Net sales
2,220
5,893
(62.3)
5,954
(62.7)
EBITDA
2,350
5,755
(59.2)
5,510
(57.4)
EBITDA margin (%)
105.9
97.7
92.5
Net profit
1,290
1,619
(20.3)
1,421
(9.2)
Power Grid Corp of India Ltd - Nov 9, 2016
Particulars ( ` cr)
2QFY17E
2QFY16
y-o-y (%)
1QFY17
q-o-q (%)
Net sales
5,815
4,918
18.2
6,120
(5.0)
EBITDA
5,192
4,318
20.2
5,420
(4.2)
EBITDA margin (%)
89.3
87.8
88.6
Net profit
1,614
1,448
11.5
1,802
(10.4)
Cipla Ltd - Nov 9, 2016
Particulars ( ` cr)
2QFY17E
2QFY16
y-o-y (%)
1QFY17
q-o-q (%)
Net sales
3781
3452
9.5
3499
8.0
EBITDA
675
789
(14.4)
611
10.5
EBITDA margin (%)
17.9
22.9
Net profit
387
431
(10.2)
365
6.0
Bosch Ltd - Nov 9, 2016
Particulars ( ` cr)
2QFY17E
2QFY16
y-o-y (%)
1QFY17
q-o-q (%)
Net sales
2,846
2,618
8.7
2,519
13
EBITDA
531
452
17.5
451
17.7
EBITDA margin (%)
18.7
17.3
17.9
Net profit
365
305
19.7
379
(3.7)
Market Outlook
November 09, 2016
Top Picks ★★★★★
Large Cap
Market Cap
CMP
Target
Upside
Company
Rationale
(` Cr)
(`)
(`)
(%)
To outpace battery industry growth due to better technological
Amara Raja Batteries
17,259
1,010
1,218
20.5
products leading to market share gains in both the
automotive OEM and replacement segments.
The stock is trading at attractive valuations and is factoring all
HCL Tech
1,14,038
808
1,000
23.7
the bad news.
Back on the growth trend, expect a long term growth of 14%
Infosys
2,25,744
983
1,249
27.1
to be a US$20bn in FY2020.
Source: Company, Angel Research
Mid Cap
Market Cap
CMP
Target
Upside
Company
Rationale
(` Cr)
(`)
(`)
(%)
We expect the company would report strong profitability
Asian Granito
785
261
351
34.6
owing to better product mix, higher B2C sales and
amalgamation synergy.
Among the top 4 players in the consumer durables segment.
Bajaj Electricals
2,485
246
306
24.5
Improved profitability backed by turn around in E&P segment.
Strong order book lends earnings visibility.
Favourable outlook for the AC industry to augur well for
Cooling products business which is out pacing the market
Blue Star
5,183
544
634
16.6
growth. EMPPAC division's profitability to improve once
operating environment turns around.
With a focus on the low and medium income (LMI) consumer
Dewan Housing Finance
9,831
314
350
11.4
segment, the company has increased its presence in tier-II &
III cities where the growth opportunity is immense.
Strong loan growth backed by diversified loan portfolio and
Equitas Holdings
5,713
170
235
38.0
adequate CAR. ROE & ROA likely to remain decent as risk of
dilution remains low. Attractive valuations considering growth.
Economic recovery to have favourable impact on advertising
& circulation revenue growth. Further, the acquisition of a
Jagran Prakashan
6,143
188
225
19.7
radio business (Radio City) would also boost the company's
revenue growth.
Speedier execution and speedier sales, strong revenue visibilty
Mahindra Lifespace
1,726
421
522
24.1
in short-to-long run, attractive valuations
We expect the company to report strong growth on back of
healthy growth in domestic branded sales (owing to
Mirza International
1,076
89
113
26.3
aggressive ad spend and addition in the number of EBOs &
multi-brand outlets [MBOs]) and healthy export revenues.
Massive capacity expansion along with rail advantage at ICD
Navkar Corporation
2,814
197
265
34.3
as well CFS augurs well for the company.
Strong brands and distribution network would boost growth
Siyaram Silk Mills
1,393
1,486
1,714
15.4
going ahead. Stock currently trades at an inexpensive
valuation.
Market leadership in Hindi news genre and no. 2 viewership
ranking in English news genre, exit from the radio business,
TV Today Network
1,998
335
385
14.9
and anticipated growth in ad spends by corporates to benefit
the stock.
Source: Company, Angel Research
Market Outlook
November 9, 2016
Key Upcoming Events
Result Calendar
Date
Company
Bosch India, Apollo Tyres, JK Tyre, Ramco Cements, J & K Bank, Rural Elec.Corp., Indian Bank, Oriental
November 09, 2016
Bank, UCO Bank, ITD Cementation, Cipla, Lupin, Orchid Chemicals, Power Grid Corpn
Tata Chemicals, Motherson Sumi, Thermax, Areva, Blue Star, Power Fin.Corpn., Page Industries, Bajaj
November 10, 2016
Electrical, Finolex Cables, Elecon Engineering, Sun Pharma, Team Lease Serv.
FAG Bearings, St Bk of India, Bank of Baroda, Andhra Bank, IOB, Tata Steel, BPCL, Styrolution, Ipca labs,
November 11, 2016
Reliance Power, MT Educare, Quick Heal
November 12, 2016 Hindalco, Banco, Divi's Lab., Reliance Infra., PTC India
Source: Bloomberg, Angel Research
Global economic events release calendar
Bloomberg Data
Date
Time
Country
Event Description
Unit
Period
Last Reported
Estimated
Nov 09, 2016
7:00 PM
US
Initial Jobless claims
Thousands
Nov 5
265.00
260.00
Nov 10, 2016
7:00 AM
China
Consumer Price Index (YoY)
% Change Oct
1.90
2.10
India
Imports YoY%
% Change Oct
(2.50)
7:30 AM
China
Industrial Production (YoY)
% Change Oct
6.10
6.20
Nov 11, 2016
India
Exports YoY%
% Change Oct
4.60
Nov 14, 2016
5:30 PM
India
Industrial Production YoY
% Change Sep
(0.70)
0.60
12:00 PM
India Monthly Wholesale Prices YoY%
% Change Oct
3.57
Nov 15, 2016
3:30 PM Euro Zone
Euro-Zone GDP s.a. (QoQ)
% Change 3Q P
0.30
3:00 PM
UK
CPI (YoY)
% Change Oct
1.00
12:30 PM Germany
GDP nsa (YoY)
% Change 3Q P
3.10
Nov 16, 2016
3:00 PM
UK
Jobless claims change
% Change Oct
0.70
7:45 PM
US
Industrial Production
% Oct
0.06
0.20
US
Producer Price Index (mom)
% Change Oct
0.80
Nov 17, 2016
7:00 PM
US
Housing Starts
Thousands Oct
1,047.00
1,165.00
7:00 PM
US
Building permits
Thousands Oct
1,225.00
1,190.00
3:30 PM Euro Zone
Euro-Zone CPI (YoY)
% Oct F
0.50
7:00 PM
US Consumer price index (mom)
% Change Oct
0.30
0.40
Nov 22, 2016
8:30 PM Euro ZoneEuro-Zone Consumer Confidence
Value
Nov A
(8.00)
8:30 PM
US
Existing home sales
Million
Oct
5.47
Source: Bloomberg, Angel Research
Market Outlook
November 09, 2016
Macro watch
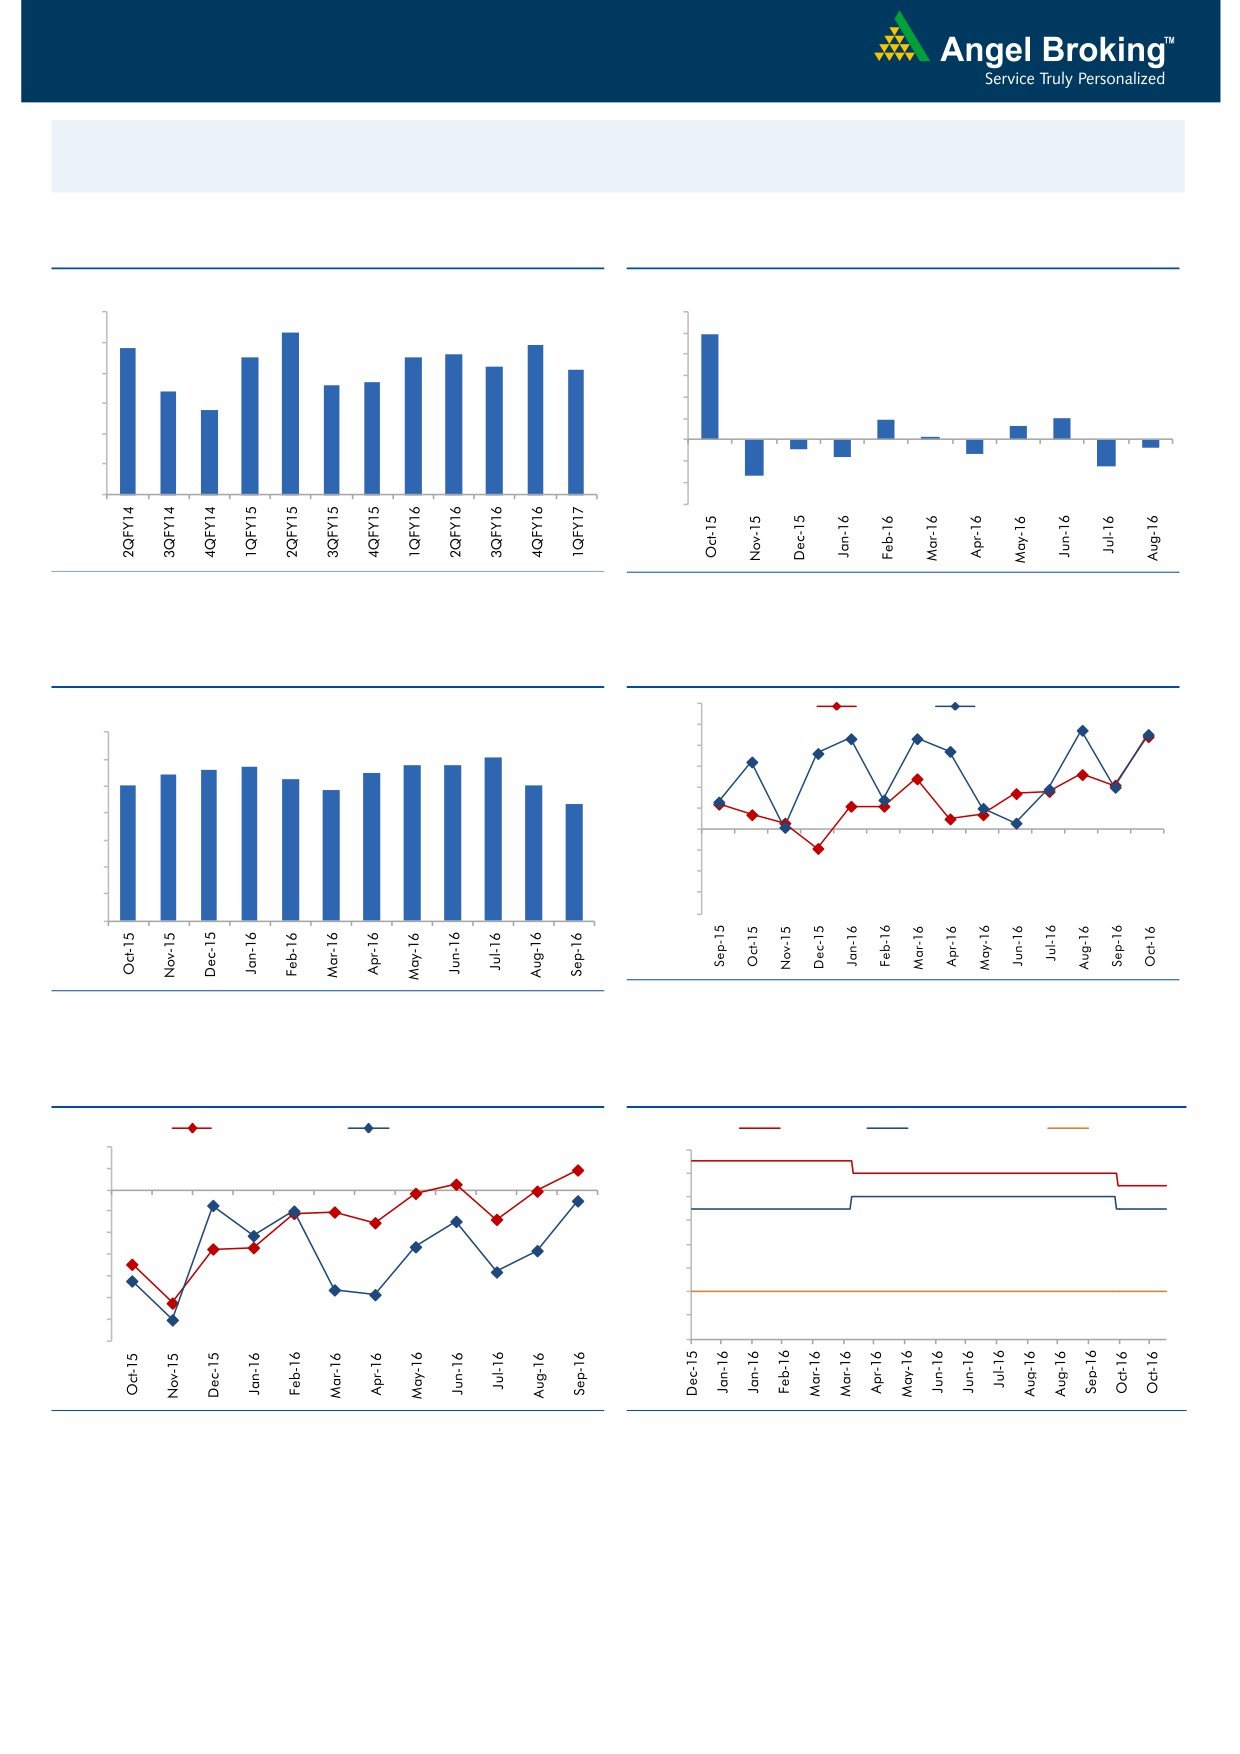
Exhibit 1: Quarterly GDP trends
Exhibit 2: IIP trends
(%)
(%)
9.0
12.0
8.3
9.9
7.8
7.9
10.0
8.0
7.5
7.5
7.6
7.2
7.1
8.0
6.6
6.7
7.0
6.4
6.0
5.8
6.0
4.0
1.9
2.0
1.3
2.0
0.3
5.0
-
4.0
(2.0)
(0.7)
(0.9)
(1.3)
(1.6)
(4.0)
(2.5)
3.0
(3.4)
(6.0)
Source: CSO, Angel Research
Source: MOSPI, Angel Research
Exhibit 3: Monthly CPI inflation trends
Exhibit 4: Manufacturing and services PMI
56.0
Mfg. PMI
Services PMI
(%)
55.0
7.0
6.1
54.0
5.6
5.7
5.8
5.8
6.0
5.4
5.5
5.0
5.3
5.1
53.0
4.8
5.0
4.3
52.0
4.0
51.0
50.0
3.0
49.0
2.0
48.0
1.0
47.0
46.0
-
Source: Market, Angel Research; Note: Level above 50 indicates expansion
Source: MOSPI, Angel Research
Exhibit 5: Exports and imports growth trends
Exhibit 6: Key policy rates
(%)
Exports yoy growth
Imports yoy growth
(%)
Repo rate
Reverse Repo rate
CRR
10.0
7.00
5.0
6.50
0.0
6.00
(5.0)
5.50
(10.0)
5.00
(15.0)
4.50
(20.0)
4.00
(25.0)
(30.0)
3.50
(35.0)
3.00
Source: Bloomberg, Angel Research
Source: RBI, Angel Research
Stock Watch
November 09, 2016
Company Name
Reco
CMP
Target
Mkt Cap
Sales ( Čcr )
OPM(%)
EPS (Č)
PER(x)
P/BV(x)
RoE(%)
EV/Sales(x)
(Č)
Price ( Č)
( Č cr )
FY17E FY18E
FY17E
FY18E
FY17E
FY18E
FY17E
FY18E
FY17E
FY18E
FY17E
FY18E
FY17E
FY18E
Agri / Agri Chemical
Rallis
Neutral
210
-
4,074
1,937
2,164
13.3
14.3
9.0
11.0
23.3
19.1
4.1
3.5
18.4
19.8
2.1
1.9
United Phosphorus
Neutral
683
-
34,630
15,176
17,604
18.5
18.5
37.4
44.6
18.3
15.3
3.6
3.0
21.4
21.2
2.4
2.0
Auto & Auto Ancillary
Ashok Leyland
Buy
92
111
26,111
22,407
26,022
10.6
10.6
5.2
6.4
17.6
14.3
4.0
3.4
23.6
24.7
1.2
1.1
Bajaj Auto
Neutral
2,866
-
82,924
25,093
27,891
19.5
19.2
143.9
162.5
19.9
17.6
5.6
4.8
30.3
29.4
3.0
2.7
Bharat Forge
Neutral
850
-
19,793
7,726
8,713
20.5
21.2
35.3
42.7
24.1
19.9
4.5
4.0
18.9
20.1
2.6
2.3
Eicher Motors
Neutral
24,268
-
65,914
16,583
20,447
17.5
18.0
598.0
745.2
40.6
32.6
13.9
10.6
41.2
38.3
3.8
3.0
Gabriel India
Accumulate
120
130
1,730
1,544
1,715
9.0
9.3
5.4
6.3
22.3
19.1
4.2
3.7
18.9
19.5
1.1
1.0
Hero Motocorp
Accumulate
3,370
3,541
67,287
30,958
34,139
15.7
15.7
193.6
208.3
17.4
16.2
6.8
5.6
34.2
30.5
2.0
1.8
Jamna Auto Industries Neutral
215
-
1,715
1,486
1,620
9.8
9.9
15.0
17.2
14.3
12.5
3.1
2.7
21.8
21.3
1.2
1.1
L G Balakrishnan & Bros Neutral
648
-
1,018
1,302
1,432
11.6
11.9
43.7
53.0
14.8
12.2
2.1
1.9
13.8
14.2
0.9
0.8
Mahindra and Mahindra Neutral
1,385
-
86,000
46,534
53,077
11.6
11.7
67.3
78.1
20.6
17.7
3.3
2.9
15.4
15.8
1.8
1.6
Maruti
Accumulate
5,662
6,006
171,036
68,057
82,958
15.8
15.5
212.1
261.2
26.7
21.7
5.3
4.4
19.8
20.3
2.2
1.7
Minda Industries
Neutral
378
-
3,002
2,728
3,042
9.0
9.1
68.2
86.2
5.6
4.4
1.3
1.0
23.8
24.3
1.2
1.0
Motherson Sumi
Neutral
312
-
43,737
45,896
53,687
7.8
8.3
13.0
16.1
23.9
19.4
7.7
6.1
34.7
35.4
1.0
0.9
Rane Brake Lining
Neutral
991
-
784
511
562
11.3
11.5
28.1
30.9
35.3
32.1
5.4
4.9
15.3
15.0
1.7
1.5
Setco Automotive
Neutral
41
-
546
741
837
13.0
13.0
15.2
17.0
2.7
2.4
0.4
0.4
15.8
16.3
1.1
1.0
Tata Motors
Neutral
540
-
155,967
300,209
338,549
8.9
8.4
42.7
54.3
12.7
10.0
2.0
1.7
15.6
17.2
0.6
0.5
TVS Motor
Neutral
390
-
18,528
13,390
15,948
6.9
7.1
12.8
16.5
30.6
23.6
7.6
6.0
26.3
27.2
1.4
1.2
Amara Raja Batteries
Buy
1,010
1,218
17,259
5,429
6,471
17.5
17.6
35.3
43.5
28.6
23.2
6.6
5.3
25.3
24.8
3.0
2.5
Exide Industries
Neutral
194
-
16,477
7,439
8,307
15.0
15.0
8.1
9.3
23.9
20.8
3.4
3.0
14.3
16.7
1.8
1.6
Apollo Tyres
Buy
198
235
10,063
12,877
14,504
14.3
13.9
21.4
23.0
9.2
8.6
1.4
1.3
16.4
15.2
0.9
0.9
Ceat
Accumulate
1,306
1,450
5,283
7,524
8,624
13.0
12.7
131.1
144.3
10.0
9.1
1.8
1.6
19.8
18.6
0.8
0.7
JK Tyres
Neutral
142
-
3,226
7,455
8,056
15.0
15.0
21.8
24.5
6.5
5.8
1.4
1.1
22.8
21.3
0.6
0.5
Swaraj Engines
Neutral
1,400
-
1,739
660
810
15.2
16.4
54.5
72.8
25.7
19.2
8.0
7.3
31.5
39.2
2.5
2.0
Subros
Neutral
167
-
1,002
1,488
1,681
11.7
11.9
6.4
7.2
26.1
23.3
2.8
2.5
10.8
11.4
0.9
0.8
Indag Rubber
Neutral
187
-
490
286
326
19.8
16.8
11.7
13.3
16.0
14.0
2.7
2.5
17.8
17.1
1.4
1.2
Capital Goods
ACE
Neutral
51
-
509
709
814
4.1
4.6
1.4
2.1
36.8
24.5
1.5
1.4
4.4
6.0
0.9
0.8
BEML
Neutral
910
-
3,788
3,451
4,055
6.3
9.2
31.4
57.9
29.0
15.7
1.7
1.6
6.3
10.9
1.2
1.0
Bharat Electronics
Accumulate
1,319
1,414
31,663
8,137
9,169
16.8
17.2
58.7
62.5
22.5
21.1
3.5
3.1
44.6
46.3
2.9
2.6
Stock Watch
November 09, 2016
Company Name
Reco
CMP
Target
Mkt Cap
Sales ( Čcr )
OPM(%)
EPS (Č)
PER(x)
P/BV(x)
RoE(%)
EV/Sales(x)
(Č)
Price ( Č)
( Č cr )
FY17E
FY18E
FY17E
FY18E
FY17E
FY18E
FY17E
FY18E
FY17E
FY18E
FY17E
FY18E
FY17E
FY18E
Capital Goods
Voltas
Accumulate
357
407
11,826
6,511
7,514
7.9
8.7
12.9
16.3
27.7
21.9
5.0
4.4
16.7
18.5
1.6
1.3
BGR Energy
Neutral
115
-
830
16,567
33,848
6.0
5.6
7.8
5.9
14.7
19.5
0.8
0.8
4.7
4.2
0.2
0.1
BHEL
Neutral
143
-
35,037
28,797
34,742
-
2.8
2.3
6.9
62.2
20.8
1.1
1.0
1.3
4.8
0.9
0.6
Blue Star
Buy
544
634
5,183
4,283
5,077
5.9
7.3
14.9
22.1
36.5
24.6
7.1
6.0
20.4
26.4
1.3
1.1
Crompton Greaves
Neutral
83
-
5,199
5,777
6,120
5.9
7.0
3.3
4.5
25.1
18.4
1.1
1.1
4.4
5.9
0.9
0.7
Greaves Cotton
Neutral
132
-
3,225
1,755
1,881
16.8
16.9
7.8
8.5
16.9
15.5
3.4
3.1
20.6
20.9
1.5
1.4
Inox Wind
Neutral
208
-
4,616
5,605
6,267
15.7
16.4
24.8
30.0
8.4
6.9
2.3
1.7
25.9
24.4
0.9
0.7
KEC International
Neutral
131
-
3,358
9,294
10,186
7.9
8.1
9.9
11.9
13.2
11.0
1.9
1.7
15.6
16.3
0.6
0.5
Thermax
Neutral
855
-
10,185
5,421
5,940
7.3
7.3
25.7
30.2
33.3
28.3
4.0
3.7
12.2
13.1
1.8
1.6
VATech Wabag
Buy
467
681
2,547
3,136
3,845
8.9
9.1
26.0
35.9
18.0
13.0
2.3
1.9
13.4
15.9
0.7
0.6
Cement
ACC
Neutral
1,504
-
28,239
11,225
13,172
13.2
16.9
44.5
75.5
33.8
19.9
3.2
3.0
11.2
14.2
2.5
2.1
Ambuja Cements
Neutral
244
-
48,480
9,350
10,979
18.2
22.5
5.8
9.5
42.1
25.7
3.5
3.2
10.2
12.5
5.2
4.4
India Cements
Neutral
155
-
4,774
4,364
4,997
18.5
19.2
7.9
11.3
19.7
13.8
1.4
1.4
8.0
8.5
1.9
1.6
JK Cement
Neutral
912
-
6,379
4,398
5,173
15.5
17.5
31.2
55.5
29.2
16.4
3.5
3.0
12.0
15.5
2.0
1.7
J K Lakshmi Cement
Buy
467
565
5,491
2,913
3,412
14.5
19.5
7.5
22.5
62.2
20.7
3.8
3.2
12.5
18.0
2.5
2.1
Orient Cement
Buy
170
215
3,491
2,114
2,558
18.5
20.5
8.1
11.3
21.0
15.1
3.1
2.6
9.0
14.0
2.3
1.8
UltraTech Cement
Neutral
3,958
-
108,625
25,768
30,385
21.0
23.5
111.0
160.0
35.7
24.7
4.6
4.0
13.5
15.8
4.3
3.6
Construction
ITNL
Neutral
100
-
3,304
8,946
10,017
31.0
31.6
8.1
9.1
12.4
11.0
0.5
0.5
4.2
5.0
3.7
3.4
KNR Constructions
Accumulate
709
802
1,993
1,385
1,673
14.7
14.0
41.2
48.5
17.2
14.6
3.2
2.8
14.9
15.2
1.5
1.3
Larsen & Toubro
Buy
1,396
1,700
130,132
67,665
77,249
10.7
11.5
57.3
71.2
24.4
19.6
2.2
2.1
12.6
14.3
2.1
1.8
Gujarat Pipavav Port
Neutral
163
-
7,866
705
788
52.2
51.7
5.0
5.6
32.5
29.1
3.2
2.9
11.2
11.2
10.8
9.2
Nagarjuna Const.
Neutral
86
-
4,781
8,842
9,775
9.1
8.8
5.3
6.4
16.2
13.4
1.3
1.2
8.2
9.1
0.7
0.6
PNC Infratech
Buy
116
143
2,978
2,350
2,904
13.1
13.2
9.0
8.8
12.9
13.2
0.5
0.4
15.9
13.9
1.4
1.1
Simplex Infra
Neutral
319
-
1,577
6,829
7,954
10.5
10.5
31.4
37.4
10.2
8.5
1.1
1.0
9.9
13.4
0.7
0.6
Power Mech Projects
Neutral
480
-
706
1,801
2,219
12.7
14.6
72.1
113.9
6.7
4.2
1.2
1.0
16.8
11.9
0.4
0.3
Sadbhav Engineering
Accumulate
276
298
4,739
3,598
4,140
10.3
10.6
9.0
11.9
30.7
23.2
3.2
2.8
9.9
11.9
1.6
1.4
NBCC
Neutral
235
-
14,070
7,428
9,549
7.9
8.6
8.2
11.0
28.6
21.3
1.4
1.1
28.2
28.7
1.6
1.2
MEP Infra
Neutral
40
-
649
1,877
1,943
30.6
29.8
3.0
4.2
13.3
9.5
6.4
4.3
0.6
0.6
1.7
1.6
SIPL
Neutral
101
-
3,572
1,036
1,252
65.5
66.2
(8.4)
(5.6)
3.8
4.3
(22.8)
(15.9)
11.7
9.7
Stock Watch
November 09, 2016
Company Name
Reco
CMP
Target
Mkt Cap
Sales ( Čcr )
OPM(%)
EPS (Č)
PER(x)
P/BV(x)
RoE(%)
EV/Sales(x)
(Č)
Price ( Č)
( Č cr )
FY17E
FY18E
FY17E
FY18E
FY17E
FY18E
FY17E
FY18E
FY17E
FY18E
FY17E
FY18E
FY17E
FY18E
Construction
Engineers India
Neutral
262
-
8,831
1,725
1,935
16.0
19.1
11.4
13.9
23.0
18.9
3.2
3.1
13.4
15.3
4.0
3.6
Financials
Axis Bank
Buy
491
630
117,142
46,932
53,575
3.5
3.4
32.4
44.6
15.2
11.0
2.0
1.7
13.6
16.5
-
-
Bank of Baroda
Neutral
149
-
34,332
19,980
23,178
1.8
1.8
11.5
17.3
13.0
8.6
1.5
1.2
8.3
10.1
-
-
Canara Bank
Neutral
297
-
16,105
15,225
16,836
1.8
1.8
14.5
28.0
20.5
10.6
1.4
1.1
5.8
8.5
-
-
Dewan Housing Finance Accumulate
314
350
9,831
2,225
2,688
2.9
2.9
29.7
34.6
10.6
9.1
1.7
1.5
16.1
16.8
-
-
Equitas Holdings
Buy
170
235
5,713
939
1,281
11.7
11.5
5.8
8.2
29.4
20.8
2.5
2.3
10.9
11.5
-
-
Federal Bank
Neutral
77
-
13,264
9,353
10,623
2.9
2.9
4.4
5.8
17.6
13.3
1.7
1.5
9.5
11.0
-
-
HDFC
Neutral
1,389
-
219,557
11,475
13,450
3.4
3.4
45.3
52.5
30.7
26.5
5.9
5.2
20.2
20.5
-
-
HDFC Bank
Accumulate
1,255
1,350
317,632
46,097
55,433
4.5
4.5
58.4
68.0
21.5
18.5
3.8
3.2
18.8
18.6
-
-
ICICI Bank
Neutral
283
-
164,799
39,029
45,903
3.3
3.3
16.7
16.3
17.0
17.4
2.1
1.9
10.1
12.4
-
-
LIC Housing Finance
Accumulate
549
630
27,714
3,712
4,293
2.6
2.5
39.0
46.0
14.1
11.9
2.6
2.3
19.9
20.1
-
-
Punjab Natl.Bank
Neutral
141
-
29,919
23,532
23,595
2.3
2.4
6.8
12.6
20.7
11.2
3.2
2.3
3.3
6.5
-
-
RBL Bank
Neutral
386
-
14,273
1,783
2,309
2.6
2.6
12.7
16.4
30.4
23.5
3.3
3.0
12.8
13.3
-
-
South Ind.Bank
Neutral
23
-
3,092
6,435
7,578
2.5
2.5
2.7
3.1
8.5
7.4
1.1
0.9
10.1
11.2
-
-
St Bk of India
Neutral
253
-
196,088
88,650
98,335
2.6
2.6
13.5
18.8
18.7
13.4
1.8
1.6
7.0
8.5
-
-
Union Bank
Neutral
130
-
8,906
13,450
14,925
2.3
2.3
25.5
34.5
5.1
3.8
0.7
0.6
7.5
10.2
-
-
Yes Bank
Neutral
1,224
-
51,528
8,978
11,281
3.3
3.4
74.0
90.0
16.5
13.6
3.1
2.7
17.0
17.2
-
-
FMCG
Asian Paints
Neutral
1,057
-
101,339
17,128
18,978
16.8
16.4
19.1
20.7
55.3
51.0
19.2
18.2
34.8
35.5
5.8
5.3
Britannia
Accumulate
3,232
3,626
38,779
9,795
11,040
14.6
14.9
80.3
94.0
40.3
34.4
16.6
12.8
41.2
-
3.8
3.3
Colgate
Neutral
980
-
26,641
4,605
5,149
23.4
23.4
23.8
26.9
41.2
36.4
22.8
17.8
64.8
66.8
5.7
5.1
Dabur India
Neutral
298
-
52,334
8,315
9,405
19.8
20.7
8.1
9.2
36.7
32.3
10.2
8.5
31.6
31.0
5.9
5.2
GlaxoSmith Con*
Neutral
5,731
-
24,101
4,350
4,823
21.2
21.4
179.2
196.5
32.0
29.2
8.5
7.2
27.1
26.8
4.9
4.4
Godrej Consumer
Neutral
1,533
-
52,200
10,235
11,428
18.4
18.6
41.1
44.2
37.3
34.7
8.3
7.0
24.9
24.8
5.2
4.6
HUL
Neutral
843
-
182,381
35,252
38,495
17.8
17.8
20.7
22.4
40.8
37.6
39.0
33.5
95.6
88.9
5.0
4.6
ITC
Accumulate
256
284
308,711
40,059
44,439
38.3
39.2
9.0
10.1
28.5
25.2
7.9
6.9
27.8
27.5
7.2
6.5
Marico
Buy
261
300
33,622
6,430
7,349
18.8
19.5
6.4
7.7
40.7
33.8
12.3
10.3
33.2
32.5
5.0
4.4
Nestle*
Neutral
6,451
-
62,198
10,073
11,807
20.7
21.5
124.8
154.2
51.7
41.8
21.2
19.1
34.8
36.7
6.0
5.1
Tata Global
Neutral
127
-
8,044
8,675
9,088
9.8
9.8
7.4
8.2
17.2
15.5
2.0
1.9
7.9
8.1
0.8
0.8
Procter & Gamble
Accumulate
6,897
7,369
22,387
2,939
3,342
23.2
23.0
146.2
163.7
47.2
42.1
105.6
101.3
25.3
23.5
7.2
6.2
Hygiene
Stock Watch
November 09, 2016
Company Name
Reco
CMP
Target
Mkt Cap
Sales ( Čcr )
OPM(%)
EPS (Č)
PER(x)
P/BV(x)
RoE(%)
EV/Sales(x)
(Č)
Price ( Č)
( Č cr )
FY17E FY18E
FY17E
FY18E
FY17E
FY18E
FY17E
FY18E
FY17E
FY18E
FY17E
FY18E
FY17E
FY18E
IT
HCL Tech^
Buy
808
1,000
114,038
49,242
57,168
20.5
20.5
55.7
64.1
14.5
12.6
3.0
2.3
20.3
17.9
2.2
1.8
Infosys
Buy
983
1,249
225,744
68,350
77,326
27.0
27.0
62.5
69.4
15.7
14.2
3.4
3.1
21.3
21.6
2.7
2.4
TCS
Accumulate
2,284
2,620
449,987
119,025
133,308
27.6
27.6
131.2
145.5
17.4
15.7
5.6
5.2
32.4
33.1
3.6
3.1
Tech Mahindra
Buy
453
600
44,007
29,673
32,937
15.5
17.0
32.8
39.9
13.8
11.4
2.7
2.4
19.6
20.7
1.2
1.0
Wipro
Buy
453
590
110,100
55,440
60,430
18.1
18.1
35.9
39.9
12.6
11.4
2.3
2.1
19.0
19.3
1.7
1.6
Media
D B Corp
Neutral
382
-
7,019
2,297
2,590
27.4
28.2
21.0
23.4
18.2
16.3
4.2
3.7
23.7
23.1
2.9
2.5
HT Media
Neutral
82
-
1,899
2,693
2,991
12.6
12.9
7.9
9.0
10.3
9.1
0.9
0.8
7.8
8.3
0.3
0.2
Jagran Prakashan
Buy
188
225
6,143
2,355
2,635
28.0
28.0
10.8
12.5
17.4
15.0
3.8
3.3
21.7
21.7
2.6
2.3
Sun TV Network
Neutral
526
-
20,723
2,850
3,265
70.1
71.0
26.2
30.4
20.1
17.3
5.1
4.5
24.3
25.6
6.9
5.9
Hindustan Media
Neutral
290
-
2,128
1,016
1,138
24.3
25.2
27.3
30.1
10.6
9.6
2.0
1.8
16.2
15.8
1.4
1.2
Ventures
TV Today Network
Accumulate
335
385
1,998
637
743
27.5
27.5
18.4
21.4
18.2
15.7
3.2
2.7
17.4
17.2
2.7
2.3
Metals & Mining
Coal India
Neutral
317
-
200,197
84,638
94,297
21.4
22.3
24.5
27.1
12.9
11.7
5.4
5.1
42.6
46.0
1.9
1.7
Hind. Zinc
Neutral
259
-
109,499
14,252
18,465
55.9
48.3
15.8
21.5
16.4
12.1
2.7
2.3
17.0
20.7
7.7
5.9
Hindalco
Neutral
168
-
34,650
107,899
112,095
7.4
8.2
9.2
13.0
18.2
12.9
0.9
0.8
4.8
6.6
0.8
0.8
JSW Steel
Neutral
1,654
-
39,989
53,201
58,779
16.1
16.2
130.6
153.7
12.7
10.8
1.7
1.5
14.0
14.4
1.5
1.3
NMDC
Neutral
127
-
40,213
6,643
7,284
44.4
47.7
7.1
7.7
17.9
16.5
1.6
1.5
8.8
9.2
3.8
3.4
SAIL
Neutral
51
-
21,187
47,528
53,738
(0.7)
2.1
(1.9)
2.6
19.7
0.6
0.5
(1.6)
3.9
1.3
1.2
Vedanta
Neutral
220
-
65,179
71,744
81,944
19.2
21.7
13.4
20.1
16.4
10.9
1.4
1.3
8.4
11.3
1.3
1.0
Tata Steel
Neutral
409
-
39,684
121,374
121,856
7.2
8.4
18.6
34.3
22.0
11.9
1.4
1.3
6.1
10.1
1.0
0.9
Oil & Gas
Cairn India
Neutral
245
-
45,906
9,127
10,632
4.3
20.6
8.8
11.7
27.8
20.9
0.9
0.9
3.3
4.2
6.5
5.4
GAIL
Neutral
439
-
55,667
56,220
65,198
9.3
10.1
27.1
33.3
16.2
13.2
1.5
1.4
9.3
10.7
1.2
1.0
ONGC
Neutral
271
-
231,683
137,222
152,563
15.0
21.8
19.5
24.1
13.9
11.2
1.2
1.1
8.5
10.1
2.0
1.8
Indian Oil Corp
Neutral
318
-
154,636
373,359
428,656
5.9
5.5
54.0
59.3
5.9
5.4
0.9
0.8
16.0
15.6
0.6
0.5
Reliance Industries
Neutral
1,003
-
325,169
301,963
358,039
12.1
12.6
87.7
101.7
11.4
9.9
1.2
1.1
10.7
11.3
1.6
1.3
Pharmaceuticals
Alembic Pharma
Neutral
655
-
12,351
3,483
4,083
20.2
21.4
24.3
30.4
27.0
21.6
6.1
4.9
25.5
25.3
3.5
2.9
Aurobindo Pharma
Buy
757
877
44,283
15,720
18,078
23.7
23.7
41.4
47.3
18.3
16.0
4.8
3.7
29.6
26.1
3.0
2.6
Aventis*
Neutral
4,277
-
9,850
2,357
2,692
17.3
17.3
153.5
169.2
27.9
25.3
4.7
3.8
25.8
28.4
3.9
3.1
Cadila Healthcare
Accumulate
375
400
38,401
10,429
12,318
22.6
22.0
16.9
19.2
22.2
19.5
5.7
4.5
28.5
25.7
3.7
3.0
Cipla
Neutral
536
-
43,091
15,378
18,089
17.4
18.4
21.6
27.2
24.8
19.7
3.2
2.8
13.7
15.2
3.0
2.5
Stock Watch
November 09, 2016
Company Name
Reco
CMP
Target
Mkt Cap
Sales ( Čcr )
OPM(%)
EPS (Č)
PER(x)
P/BV(x)
RoE(%)
EV/Sales(x)
(Č)
Price ( Č)
( Č cr )
FY17E FY18E
FY17E
FY18E
FY17E
FY18E
FY17E
FY18E
FY17E
FY18E
FY17E
FY18E
FY17E
FY18E
Pharmaceuticals
Dr Reddy's
Neutral
3,115
-
51,611
16,043
18,119
20.8
22.4
112.4
142.9
27.7
21.8
3.7
3.2
14.1
15.9
3.2
2.8
Dishman Pharma
Neutral
237
-
3,824
1,718
1,890
22.7
22.8
9.5
11.3
24.9
21.0
2.4
2.2
10.1
10.9
2.7
2.4
GSK Pharma*
Neutral
2,719
-
23,031
3,528
3,811
16.6
18.8
51.8
59.4
52.5
45.8
14.0
14.0
26.3
30.6
6.3
5.9
Indoco Remedies
Neutral
277
-
2,550
1,112
1,289
18.2
18.2
13.2
15.6
21.0
17.7
3.7
3.2
19.2
19.2
2.4
2.1
Ipca labs
Accumulate
572
613
7,214
3,303
3,799
15.3
15.3
17.3
19.7
33.1
29.0
2.9
2.6
9.1
9.4
2.3
2.0
Lupin
Buy
1,509
1,809
68,045
15,912
18,644
26.4
26.7
58.1
69.3
26.0
21.8
5.1
4.1
21.4
20.9
4.4
3.6
Sun Pharma
Buy
635
944
152,885
31,129
35,258
30.0
30.9
28.0
32.8
22.7
19.4
3.5
2.9
18.7
18.9
4.5
3.8
Power
Tata Power
Neutral
74
-
20,122
36,916
39,557
17.4
27.1
5.1
6.3
14.6
11.8
1.3
1.2
9.0
10.3
1.6
1.4
NTPC
Neutral
154
-
127,063
86,605
95,545
17.5
20.8
11.8
13.4
13.1
11.5
1.3
1.2
10.5
11.1
2.8
2.8
Power Grid
Neutral
177
-
92,599
25,763
29,762
74.3
73.1
14.8
17.3
12.0
10.2
1.9
1.6
16.9
17.5
7.9
7.5
Real Estate
Prestige Estate
Accumulate
183
210
6,863
4,707
5,105
25.2
26.0
10.3
13.0
17.8
14.1
1.4
1.3
10.3
10.2
2.6
2.3
MLIFE
Buy
421
522
1,726
1,152
1,300
22.7
24.6
29.9
35.8
14.1
11.8
1.0
1.0
7.6
8.6
2.2
1.9
Telecom
Bharti Airtel
Neutral
305
-
121,921
105,086
114,808
34.5
34.7
12.2
16.4
25.0
18.6
1.7
1.6
6.8
8.4
2.1
1.8
Idea Cellular
Neutral
73
-
26,268
40,133
43,731
37.2
37.1
6.4
6.5
11.4
11.2
1.0
0.9
8.2
7.6
1.7
1.4
zOthers
Abbott India
Neutral
4,749
-
10,090
3,153
3,583
14.1
14.4
152.2
182.7
31.2
26.0
153.2
130.8
25.6
26.1
2.9
2.5
Asian Granito
Buy
261
351
785
1,071
1,182
12.1
12.4
12.7
16.0
20.5
16.3
2.0
1.8
9.5
10.7
1.0
0.9
Bajaj Electricals
Buy
246
306
2,485
5,099
5,805
5.6
5.9
11.4
14.6
21.6
16.9
2.9
2.6
13.4
15.1
0.5
0.4
Banco Products (India)
Neutral
205
-
1,465
1,353
1,471
12.3
12.4
14.5
16.3
14.1
12.6
19.5
17.6
14.5
14.6
1.0
109.7
Coffee Day Enterprises
Neutral
224
-
4,610
2,964
3,260
20.5
21.2
4.7
8.0
-
28.0
2.6
2.4
5.5
8.5
2.0
1.7
Ltd
Competent Automobiles Neutral
186
-
114
1,137
1,256
3.1
2.7
28.0
23.6
6.6
7.9
35.7
32.3
14.3
11.5
0.1
0.1
Elecon Engineering
Neutral
62
-
672
1,482
1,660
13.7
14.5
3.9
5.8
15.8
10.6
3.7
3.4
7.8
10.9
0.8
0.7
Finolex Cables
Neutral
431
-
6,594
2,883
3,115
12.0
12.1
14.2
18.6
30.4
23.2
16.2
14.1
15.8
14.6
2.0
1.8
Garware Wall Ropes
Neutral
555
-
1,214
873
938
12.9
13.1
30.9
34.9
18.0
15.9
2.8
2.4
15.7
15.2
1.3
1.2
Goodyear India*
Neutral
793
-
1,829
1,598
1,704
10.4
10.2
49.4
52.6
16.1
15.1
74.1
65.0
18.2
17.0
0.8
116.9
Hitachi
Neutral
1,432
-
3,893
2,081
2,433
8.8
8.9
33.4
39.9
42.9
35.9
34.6
28.8
22.1
21.4
1.9
1.6
HSIL
Neutral
357
-
2,583
2,384
2,515
15.8
16.3
15.3
19.4
23.4
18.4
23.2
20.0
7.8
9.3
1.3
1.1
Interglobe Aviation
Neutral
927
-
33,407
21,122
26,005
14.5
27.6
110.7
132.1
8.4
7.0
50.1
35.8
168.5
201.1
1.6
1.2
Jyothy Laboratories
Neutral
358
-
6,501
1,440
2,052
11.5
13.0
8.5
10.0
42.1
35.8
10.2
9.5
18.6
19.3
4.8
3.3
Kirloskar Engines India
Neutral
346
-
5,007
2,554
2,800
9.9
10.0
10.5
12.1
33.0
28.6
13.8
13.0
10.7
11.7
1.6
1.4
Ltd
Stock Watch
November 09, 2016
Company Name
Reco
CMP
Target
Mkt Cap
Sales ( Čcr )
OPM(%)
EPS (Č)
PER(x)
P/BV(x)
RoE(%)
EV/Sales(x)
(Č)
Price ( Č)
( Č cr )
FY17E
FY18E
FY17E
FY18E
FY17E
FY18E
FY17E
FY18E
FY17E
FY18E
FY17E
FY18E
FY17E
FY18E
zOthers
Linc Pen & Plastics
Neutral
255
-
377
382
420
9.3
9.5
13.5
15.7
18.9
16.2
3.2
2.8
17.1
17.3
1.1
0.9
M M Forgings
Neutral
434
-
524
546
608
20.4
20.7
41.3
48.7
10.5
8.9
59.5
52.6
16.6
17.0
0.8
0.7
Manpasand Bever.
Neutral
702
-
4,015
836
1,087
19.6
19.4
16.9
23.8
41.6
29.5
5.0
4.4
12.0
14.8
4.5
3.4
Mirza International
Buy
89
113
1,076
1,024
1,148
18.0
18.0
6.9
8.0
13.0
11.2
2.2
1.9
16.6
16.2
1.2
1.1
MT Educare
Neutral
134
-
533
366
417
17.7
18.2
9.4
10.8
14.3
12.4
3.2
2.8
22.2
22.3
1.4
1.2
Narayana Hrudaya
Neutral
341
-
6,972
1,873
2,166
11.5
11.7
2.6
4.0
129.0
86.1
7.9
7.2
6.1
8.3
3.8
3.3
Navkar Corporation
Buy
197
265
2,814
408
612
42.9
42.3
6.8
11.5
29.1
17.2
2.0
1.8
6.9
10.5
7.8
5.2
Navneet Education
Neutral
101
-
2,417
1,062
1,147
24.0
24.0
6.1
6.6
16.7
15.3
3.4
3.0
20.6
19.8
2.4
2.2
Nilkamal
Neutral
1,551
-
2,314
1,995
2,165
10.7
10.4
69.8
80.6
22.2
19.2
88.6
77.0
16.6
16.5
1.2
1.0
Page Industries
Neutral
15,945
-
17,785
2,450
3,124
20.1
17.6
299.0
310.0
53.3
51.4
355.1
271.1
47.1
87.5
7.3
5.8
Parag Milk Foods
Neutral
313
-
2,636
1,919
2,231
9.3
9.6
9.5
12.9
33.2
24.2
5.2
4.3
15.5
17.5
1.5
1.3
Quick Heal
Neutral
236
-
1,655
408
495
27.3
27.0
7.7
8.8
30.5
26.9
2.8
2.8
9.3
10.6
3.2
2.7
Radico Khaitan
Accumulate
138
147
1,835
1,667
1,824
13.0
13.2
6.7
8.2
20.7
16.8
1.9
1.7
9.0
10.2
1.5
1.3
Relaxo Footwears
Neutral
404
-
4,847
2,085
2,469
9.2
8.2
7.6
8.0
53.4
50.8
20.7
17.7
17.9
18.8
2.4
2.1
S H Kelkar & Co.
Neutral
306
-
4,430
1,036
1,160
15.1
15.0
6.1
7.2
50.2
42.7
5.4
4.9
10.7
11.5
4.1
3.7
Siyaram Silk Mills
Accumulate
1,486
1,714
1,393
1,799
2,040
11.6
11.7
104.9
122.4
14.2
12.1
2.3
2.0
16.4
16.4
1.0
0.9
Styrolution ABS India*
Neutral
614
-
1,080
1,440
1,537
9.2
9.0
40.6
42.6
15.1
14.4
38.6
35.1
12.3
11.6
0.7
0.6
Surya Roshni
Neutral
220
-
965
3,342
3,625
7.8
7.5
17.3
19.8
12.7
11.1
24.2
19.4
10.5
10.8
0.5
0.5
Team Lease Serv.
Neutral
1,003
-
1,715
3,229
4,001
1.5
1.8
22.8
32.8
44.1
30.6
4.7
4.1
10.7
13.4
0.4
0.3
The Byke Hospitality
Neutral
190
-
762
287
384
20.5
20.5
7.6
10.7
25.0
17.8
5.2
4.2
20.7
23.5
2.7
2.0
Transport Corporation of
Neutral
186
-
1,425
2,671
2,911
8.5
8.8
13.9
15.7
13.4
11.9
1.8
1.6
13.7
13.8
0.6
0.6
India
TVS Srichakra
Neutral
3,747
-
2,869
2,304
2,614
13.7
13.8
231.1
266.6
16.2
14.1
421.0
331.5
33.9
29.3
1.2
1.1
UFO Moviez
Neutral
485
-
1,339
619
685
33.2
33.4
30.0
34.9
16.2
13.9
2.2
1.9
13.8
13.9
1.9
1.5
Visaka Industries
Neutral
222
-
352
1,051
1,138
10.3
10.4
21.0
23.1
10.6
9.6
28.4
26.6
9.0
9.2
0.6
0.6
VRL Logistics
Neutral
280
-
2,557
1,902
2,119
16.7
16.6
14.6
16.8
19.2
16.7
4.2
3.7
21.9
22.2
1.5
1.3
Wonderla Holidays
Neutral
375
-
2,117
287
355
38.0
40.0
11.3
14.2
33.2
26.4
4.8
4.2
21.4
23.9
7.1
5.7
Source: Company, Angel Research; Note: *December year end; #September year end; &October year end; Price as on November 08, 2016
Market Outlook
November 09, 2016
Research Team Tel: 022 - 39357800
DISCLAIMER
Angel Broking Private Limited (hereinafter referred to as “Angel”) is a registered Member of National Stock Exchange of India
Limited,Bombay Stock Exchange Limited and Metropolitan Stock Exchange Limited. It is also registered as a Depository Participant with
CDSL and Portfolio Manager with SEBI. It also has registration with AMFI as a Mutual Fund Distributor. Angel Broking Private Limited is a
registered entity with SEBI for Research Analyst in terms of SEBI (Research Analyst) Regulations, 2014 vide registration number
INH000000164. Angel or its associates has not been debarred/ suspended by SEBI or any other regulatory authority for accessing
/dealing in securities Market. Angel or its associates/analyst has not received any compensation / managed or
co-managed public offering of securities of the company covered by Analyst during the past twelve months.
This document is solely for the personal information of the recipient, and must not be singularly used as the basis of any investment
decision. Nothing in this document should be construed as investment or financial advice. Each recipient of this document should make
such investigations as they deem necessary to arrive at an independent evaluation of an investment in the securities of the companies
referred to in this document (including the merits and risks involved), and should consult their own advisors to determine the merits and
risks of such an investment.
Reports based on technical and derivative analysis center on studying charts of a stock's price movement, outstanding positions and
trading volume, as opposed to focusing on a company's fundamentals and, as such, may not match with a report on a company's
fundamentals. Investors are advised to refer the Fundamental and Technical Research Reports available on our website to evaluate the
contrary view, if any.
The information in this document has been printed on the basis of publicly available information, internal data and other reliable
sources believed to be true, but we do not represent that it is accurate or complete and it should not be relied on as such, as this
document is for general guidance only. Angel Broking Pvt. Limited or any of its affiliates/ group companies shall not be in any way
responsible for any loss or damage that may arise to any person from any inadvertent error in the information contained in this report.
Angel Broking Pvt. Limited has not independently verified all the information contained within this document. Accordingly, we cannot
testify, nor make any representation or warranty, express or implied, to the accuracy, contents or data contained within this document.
While Angel Broking Pvt. Limited endeavors to update on a reasonable basis the information discussed in this material, there may be
regulatory, compliance, or other reasons that prevent us from doing so.
This document is being supplied to you solely for your information, and its contents, information or data may not be reproduced,
redistributed or passed on, directly or indirectly.
Neither Angel Broking Pvt. Limited, nor its directors, employees or affiliates shall be liable for any loss or damage that may arise from
or in connection with the use of this information.